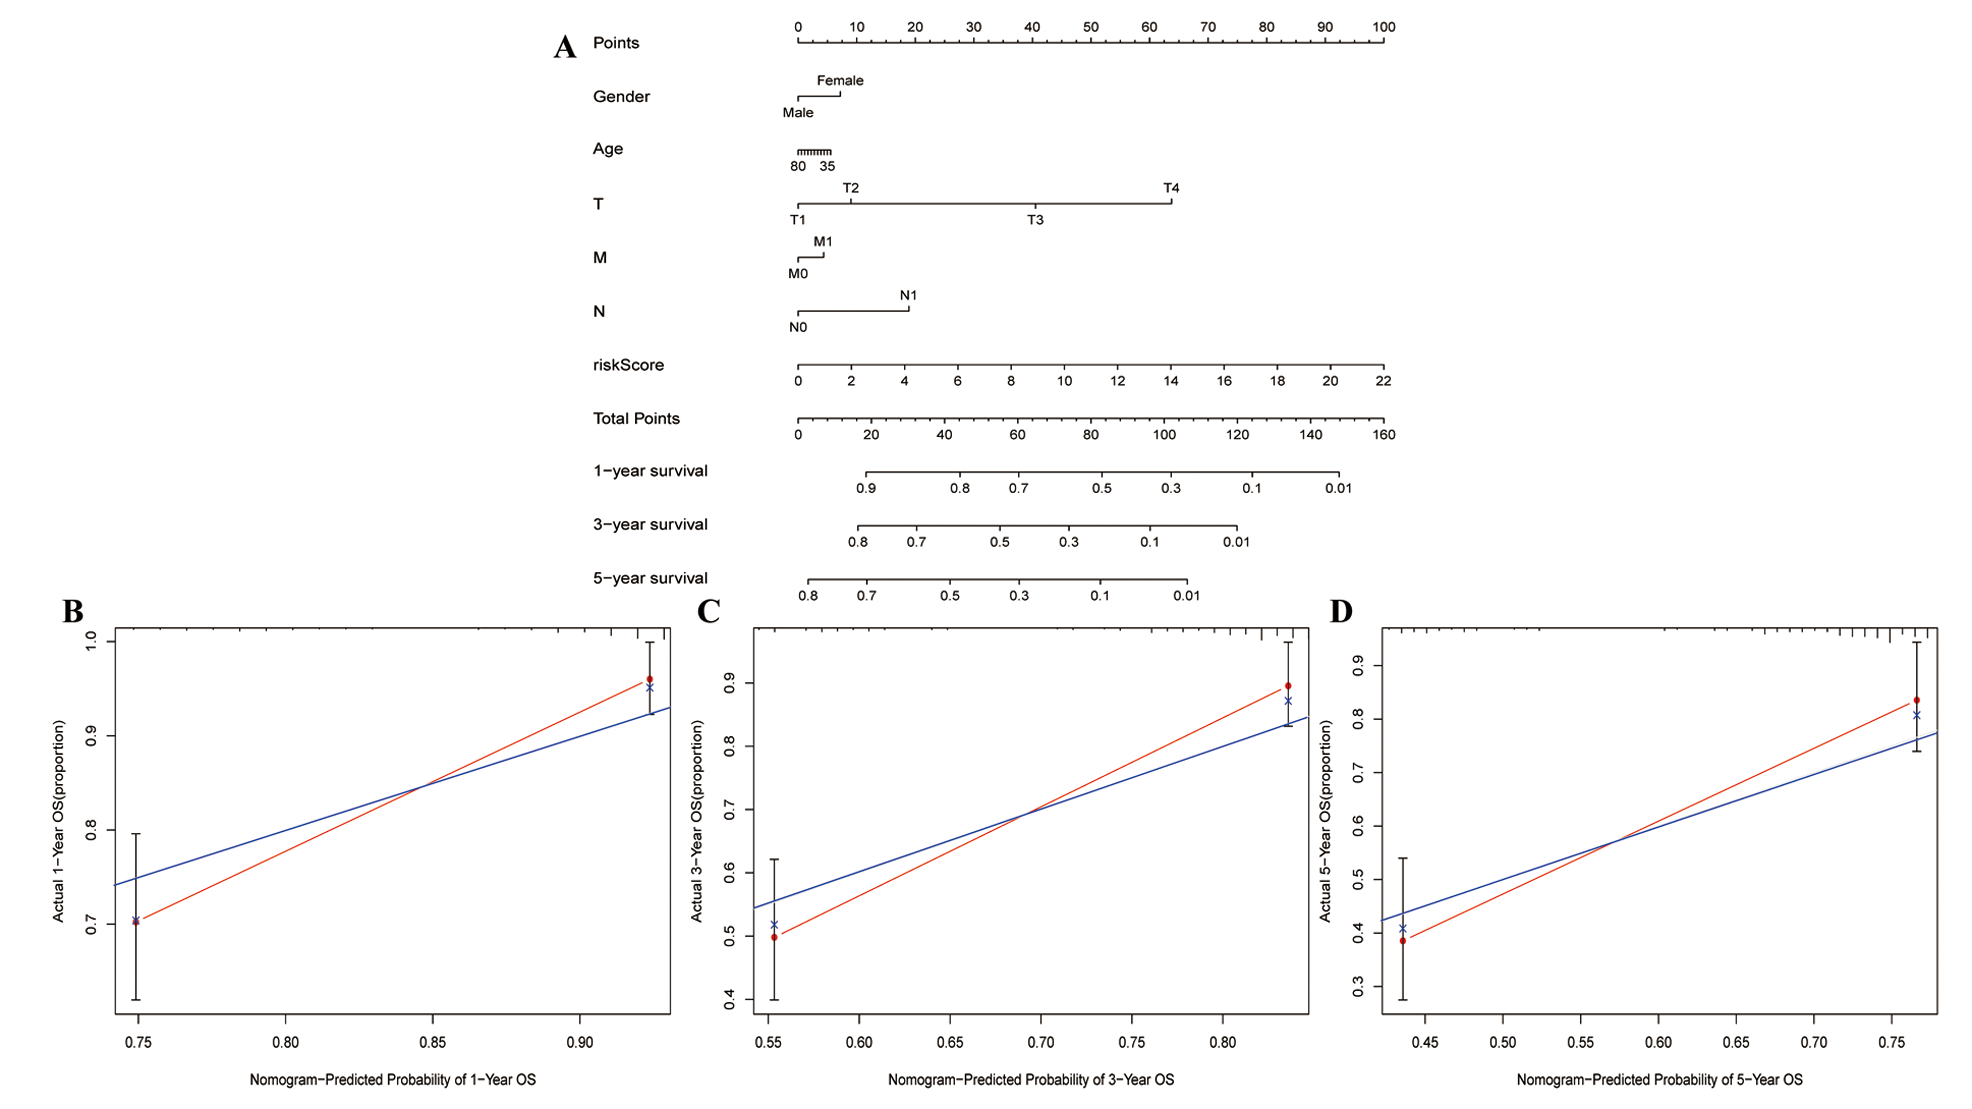
Fig.1 GO and KEGG analysis in OS-DEGs in HCC patients A: Volcano plot of 127 OS-DEGs. Pink dots represent for upregulated genes and blue dots represent for downregulated genes B: KEGG analysis of OS-DEGs. Top 10 categories of results were displayed C: GO analysis of OS-DEGs. Top 5 categories of results were displayed
Fig.2 Oxidative stress-related lncRNA signature in HCC A: Coefficient distribution diagram of Lasso regression function analysis B: The Lasso coefficient profile of 24 oxidative stress-related lncRNA C: The co-expression network of lncRNA-mRNA visualized by cytoscape D: Sankey diagram of lncRNA-mRNA
Fig. 4 The evaluation of predictive signature A: The Kaplan-Meier curve analysis of the OS rate of HCC patients in the high- and low-risk groups B: The number of dead and alive patients with different risk scores. Blue represents for death patients and orange represents for alive patients C: The distribution of the risk score among HCC patients D: ROC curve and AUCs at 1-year, 3-years and 5-years survival for the predictive signature E: Heatmap of OS-lncRNA expression in patients with high- and low risk groups
Fig.5 The correlation between the predictive signature and the prognosis of HCC patients A: Forest plot for univariate Cox regression analysis B: Forest plot for multivariate Cox regression analysis C: The ROC curve of the risk score and clinicopathological variables T represents for tumor, M represents for metastasis, N represents for lymph node
Fig.9 Internal validation of the predictive signature for OS based on the entire TCGA dataset A: Kaplan-Meier survival curve in the first internal cohort B: Kaplan-Meier survival curve in the second internal cohort C: ROC curve and AUCs at 1-year, 3-years and 5-years survival in the first internal cohort D: ROC curve and AUCs at 1-year, 3-years and 5-years survival in the second internal cohort
Fig.11 Analysis of scores of immune cell infiltration, immune cell function, and immune checkpoint expression in high-and low-risk groups A: Score of 16 immune cells infiltration in high-and low-risk groups B: Score of 13 immune cell function in high-and low-risk groups C: Analysis of differences in expression of immune checkpoints in high-and low-risk groups
Fig.12 Comparison of treatment drugs sensitivity between high- and low-risk groups A: IC50 of Nilotinib in high- and low-risk groups B: IC50 of Gefitinib in high- and low-risk groups C: IC50 of Erlotinib in high- and low-risk groups D: IC50 of Axitinib in high- and low-risk groups E: IC50 of Tipifarnib high- and low-risk groups groups F: IC50 of mitomycin C in high- and low-risk groups
Fig.13 The expression levels of AC009005.1 and its related mRNAs in HCC A: AC009005.1 are overexpressed in HCC tissues B: Compare with human liver immortalized cell line (THLE-2), AC009005.1 are overexpressed in HCC cell lines C: The expression level of AC009005.1 related mRNA in normal liver cells and liver cancer cells
Fig.17 The effect of AC009005.1 on migration, invasion, and proliferation in HepG2 cells A: Transwell assays were used to detect HCC invasion and migration. Representative experiments are shown B: Images were recorded 0 and 48 h after scratching the cell surface. representative images are shown C: The number of HCC cell colonies was reduced after AC009005.1 knockdown D: HCC cell proliferation was decreased after AC009005.1 knockdown detected by iCELLigence