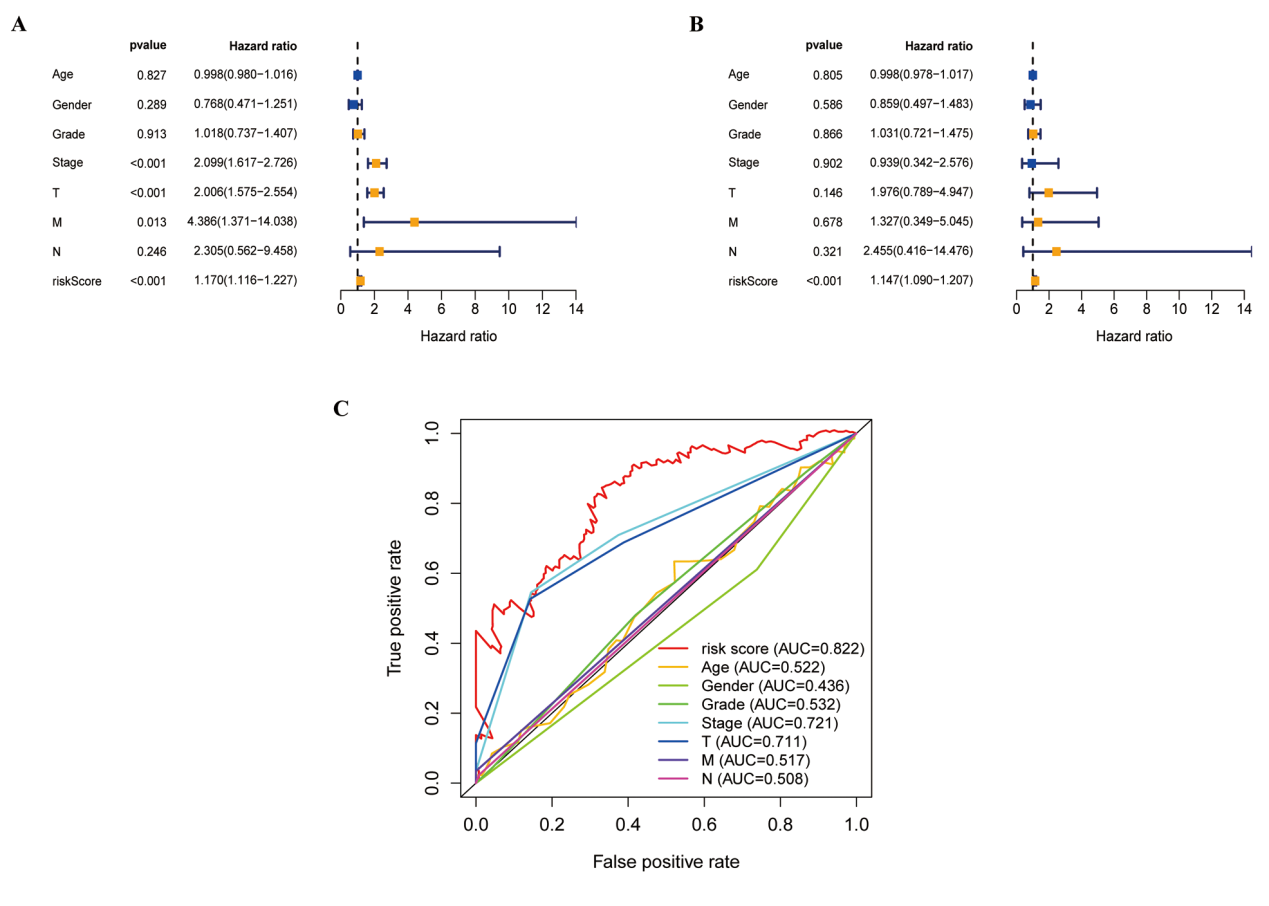
Fig.1 GO and KEGG analysis in OS-DEGs in HCC patients A: Volcano plot of 127 OS-DEGs. Pink dots represent for upregulated genes and blue dots represent for downregulated genes B: KEGG analysis of OS-DEGs. Top 10 categories of results were displayed C: GO analysis of OS-DEGs. Top 5 categories of results were displayed
Fig.2 Oxidative stress-related lncRNA signature in HCC A: Coefficient distribution diagram of Lasso regression function analysis B: The Lasso coefficient profile of 24 oxidative stress-related lncRNA C: The co-expression network of lncRNA-mRNA visualized by cytoscape D: Sankey diagram of lncRNA-mRNA
Fig. 4 The evaluation of predictive signature A: The Kaplan-Meier curve analysis of the OS rate of HCC patients in the high- and low-risk groups B: The number of dead and alive patients with different risk scores. Blue represents for death patients and orange represents for alive patients C: The distribution of the risk score among HCC patients D: ROC curve and AUCs at 1-year, 3-years and 5-years survival for the predictive signature E: Heatmap of OS-lncRNA expression in patients with high- and low risk groups
Fig.7 Construction and verification of the nomogram A: A nomogram combining clinicopathological variables and risk score predicts 1-, 3-, and 5 years OS of HCC patients B-D: The calibration curves test consistency between the actual OS rates and the predicted survival rates at 1-, 3- and 5 years Blue lines represent for predicted survival rates, and red lines represent for actual OS rates
Fig.9 Internal validation of the predictive signature for OS based on the entire TCGA dataset A: Kaplan-Meier survival curve in the first internal cohort B: Kaplan-Meier survival curve in the second internal cohort C: ROC curve and AUCs at 1-year, 3-years and 5-years survival in the first internal cohort D: ROC curve and AUCs at 1-year, 3-years and 5-years survival in the second internal cohort
Fig.11 Analysis of scores of immune cell infiltration, immune cell function, and immune checkpoint expression in high-and low-risk groups A: Score of 16 immune cells infiltration in high-and low-risk groups B: Score of 13 immune cell function in high-and low-risk groups C: Analysis of differences in expression of immune checkpoints in high-and low-risk groups
Fig.12 Comparison of treatment drugs sensitivity between high- and low-risk groups A: IC50 of Nilotinib in high- and low-risk groups B: IC50 of Gefitinib in high- and low-risk groups C: IC50 of Erlotinib in high- and low-risk groups D: IC50 of Axitinib in high- and low-risk groups E: IC50 of Tipifarnib high- and low-risk groups groups F: IC50 of mitomycin C in high- and low-risk groups
Fig.13 The expression levels of AC009005.1 and its related mRNAs in HCC A: AC009005.1 are overexpressed in HCC tissues B: Compare with human liver immortalized cell line (THLE-2), AC009005.1 are overexpressed in HCC cell lines C: The expression level of AC009005.1 related mRNA in normal liver cells and liver cancer cells
Fig.17 The effect of AC009005.1 on migration, invasion, and proliferation in HepG2 cells A: Transwell assays were used to detect HCC invasion and migration. Representative experiments are shown B: Images were recorded 0 and 48 h after scratching the cell surface. representative images are shown C: The number of HCC cell colonies was reduced after AC009005.1 knockdown D: HCC cell proliferation was decreased after AC009005.1 knockdown detected by iCELLigence